
티스토리 뷰
안녕하세요. 죠쵸입니다.

캐글의 경진대회 중 Bike Sharing Demand 경진대회의 데이터 분석 및 시각화를 Python을 통해서 진행하려고 합니다. 데이터의 분석은 좋은 머신런닝의 모델을 만드는 첫걸음이라 할 수 있습니다.
Bike Sharing Demand의 자세한 정보는 아래의 캐글 웹사이트에 접속하시면 보실 수 있습니다. 참고로 해당 경진대회는 이미 종료되었지만, 데이터 다운로드 후 예측 데이터를 제출하고 그 결과를 확인할 수 있습니다.
[캐글 Bike Sharing Demand - https://www.kaggle.com/c/bike-sharing-demand]
#Bike Sharing Demand - Competition Overview
캐글 Bike Sharing Demand 경진대회는 워싱턴 DC의 자전거 대여업체(Capital Bikeshare)의 Data를 통해서 자전거 대여 수요량을 예측하는 경진대회입니다.

[Capital Bikeshare Website - https://www.capitalbikeshare.com/how-it-works]
#Bike Sharing Demand - Competition Data
타이타닉과 경진대화와 마찬가지로 해당 경진대회의 데이터를 다운로드를 받으면 3개의 파일을 받으실 수 있습니다. train.csv와 test.csv 그리고 sampleSubmission.csv 입니다. train 데이터를 분석해서 모델을 만들고 해당 모델을 test 파일에 적용하여 캐글에 sampleSubmission 양식으로 제출하게 됩니다.
[Data Dictionary]
| Variable | Definition |
| datetime | 대여일자 및 시간 |
| season | 계절 |
| holiday | holiday 여부 |
| workingday | 주중/주말 |
| weather | 날씨 상태 |
| temp | 기온 |
| atemp | 체감 온도 |
| humidity | 습도 |
| windspeed | 풍속도 |
| casual | 비회원 대여수량 |
| registered | 회원 대여수량 |
| count | 총 대여수량 |
#Bike Sharing Demand - Notebooks
1) Importing important libraries
데이터를 처리 및 시각화하기 위해서 pandas와 seaborn 그리고 pyplot library를 Import 해 온다.
import pandas as pd
%matplotlib inline
import seaborn as sns
import matplotlib.pyplot as plt
2) Reading the dataset
데이터를 분석 및 시각화하기 위해 train 데이터를 읽어온다.
train = pd.read_csv("bike-sharing-demand/train.csv")
print(train.shape)
train.head()
3) Data Preprocessing
Date 와 시간 정보가 같이 포함하고 있는 'datetime' column을 연도별, 월별, 시간별 데이터 분석이 가능하도록 년, 월, 일, 시, 분, 초 column 으로 분리하여 추가합니다.
train['datetime'] = pd.to_datetime(train['datetime'])

train['datetime-year'] = train['datetime'].dt.year
train['datetime-month'] = train['datetime'].dt.month
train['datetime-day'] = train['datetime'].dt.day
train['datetime-hour'] = train['datetime'].dt.hour
train['datetime-minute'] = train['datetime'].dt.minute
train['datetime-second'] = train['datetime'].dt.second

train[['datetime-year', 'datetime-month', 'datetime-day', 'datetime-hour',
'datetime-minute', 'datetime-second']].head()
4) Exploratory Data Analysis(EDA)
기본적인 데이터 전처리과정을 마치고 데이터를 확인하면서 데이터의 특성을 파악한다.
train.info()
비어있는 데이터가 있는지 확인해 본다. 다행이 NAN으로 되어 있는지 컬럼은 없다.
print(train.isnull().sum())
5) Data Visualization
본격적으로 각 데이터를 그래프로 표현하여, 데이터가 갖는 특성을 추가적으로 파악한다.
2011년보다 2012년 자전거 대여수요량이 늘은 것을 확인 할 수 있다. 월별 대여량을 보았을 때 1월, 2월, 3월의 대여량이 가장 작은 것을 알 수 있다. 시간대별 그래프를 보면, 오전 8시, 오후 6시 출퇴근에 대여량이 많은 것을 확인 할 수 있다.
figure, ((ax1, ax2, ax3), (ax4, ax5, ax6)) = plt.subplots(nrows=2, ncols=3)
figure.set_size_inches(18,8)

sns.barplot(data=train, x='datetime-year', y='count', ax=ax1)
sns.barplot(data=train, x='datetime-month', y='count', ax=ax2)
sns.barplot(data=train, x='datetime-day', y='count', ax=ax3)
sns.barplot(data=train, x='datetime-hour', y='count', ax=ax4)
sns.barplot(data=train, x='datetime-minute', y='count', ax=ax5)
sns.barplot(data=train, x='datetime-second', y='count', ax=ax6)
weather 별 그래프를 확인한 결과 날씨가 나쁠 수록 대여량이 줄어든다. 하지만 날씨가 가장 안좋은 4의 경우 3보다 대여수량이 높아보이지만 신뢰도 구간이 낮은 것을 확인 할 수 있다.
sns.barplot(data=train, x='weather', y='count')
각 column 간의 상관도를 아래의 그래프를 통해서 확인 할 수 있다. count의 경우 temp, atemp, casual, registered, datetime-hour 에 연관도가 상대적으로 높은 것으로 보인다.
corrmat = train.corr()
plt.subplots(figsize=(12,9))
sns.heatmap(corrmat, annot=True, fmt='.2f', vmax=1, square=True)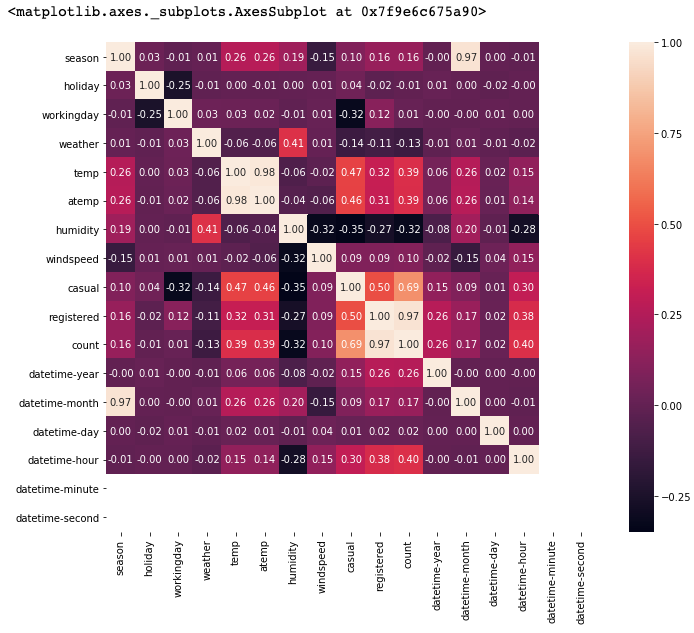
season별, 시간별 데이터를 보았을 때, 봄과 겨울이 대여량이 여름, 가을 보다 낮음을 알 수 있다. 출퇴근 시간의 대여량이 높은 것은 season에 상관없이 동일하다.
gure(figsize=(18,4))
sns.pointplot(data=train, x='datetime-hour',y='count',hue='season')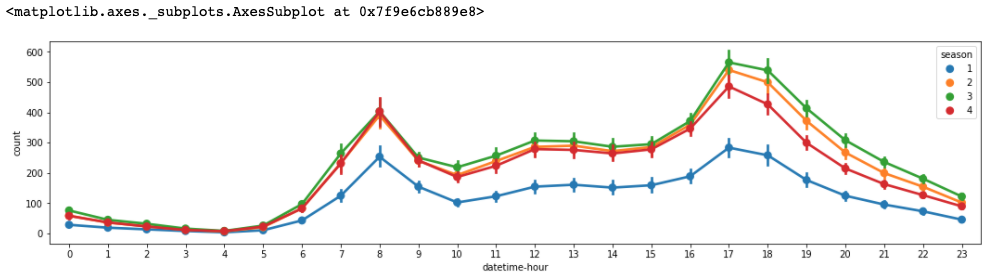
주중과 주말의 대여의 특성은 확실히 다르다. 주중에는 출퇴근시간에 집중되어 있지만, 주말의 경우는 낮시간에 많은 대여량을 보여준다.
plt.figure(figsize=(18,4))
sns.pointplot(data=train, x='datetime-hour',y='count',hue='workingday')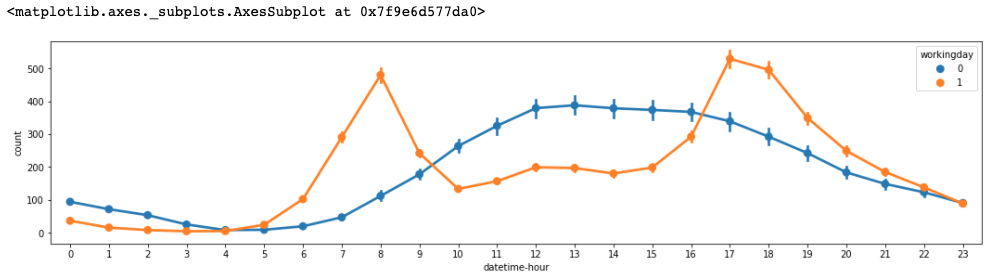
그 밖에 다른 column을 시각화하여 더 많은 특성들을 찾아 볼 수 있다. 데이터에서 파악된 특성을 통해서 확인 사항들을 통해서 가설을 만들고, 모델을 만드는 과정은 다음 포스팅에서 다시 공유 하도록 하겠습니다.
방문해 주셔서 감사합니다. 여러분의 공감하기와 구독은 저에게 힘이 됩니다.
이상으로 죠쵸였습니다.
'Data Science' 카테고리의 다른 글
| Pandas(판다스) 기초 기능 (0) | 2020.09.09 |
|---|---|
| Pandas(판다스)는 무엇인가? (11) | 2020.09.08 |
| 캐글 타이타닉 데이터 분석 및 시각화 (0) | 2020.08.30 |
| 머신러닝은 무엇인가? (2) | 2020.08.28 |
| 캐글, 누구냐 넌? (0) | 2020.08.23 |
- Total
- Today
- Yesterday
- 영어공부
- joecho
- kule
- Leetcode255
- Kaggle
- 죠쵸
- 큘가방
- 재귀함수
- ap news
- 리트코드
- 328. Odd Even Linked List
- python
- Study
- pandas
- 파이썬 독학
- Big Data
- 캐글
- Pandas(판다스)
- 판다스
- ai
- 데이터 분석
- 아디다스삼바화이트
- 파이썬
- AdSense
- English
- 티파니T1
- 파이썬 기초
- Machine Learning
- Leetcode
- 리바이스사이즈
| 일 | 월 | 화 | 수 | 목 | 금 | 토 |
|---|---|---|---|---|---|---|
| 1 | 2 | 3 | 4 | |||
| 5 | 6 | 7 | 8 | 9 | 10 | 11 |
| 12 | 13 | 14 | 15 | 16 | 17 | 18 |
| 19 | 20 | 21 | 22 | 23 | 24 | 25 |
| 26 | 27 | 28 | 29 | 30 | 31 |